What Are Intersection Counts?
Intersection counts, particularly Turning Movement Counts (TMCs), are systematic traffic data collection methods that record vehicle, pedestrian, and cyclist movements at road intersections. These counts provide critical data for traffic engineering, urban planning, and transportation infrastructure optimization.
For a broader understanding of how AI is transforming traffic analysis beyond intersection counts, see our comprehensive guide on AI Traffic Analysis. If you're looking for specific intersection counting services, visit our dedicated Intersection Counts Service page.
Why Intersection Counts Matter
- • Traffic Signal Optimization: Determine optimal signal timing and phasing
- • Capacity Analysis: Evaluate current and future traffic demands
- • Safety Improvements: Identify high-risk movements and accident patterns
- • Infrastructure Planning: Design road improvements and expansions
- • Environmental Impact: Assess traffic-related emissions and congestion
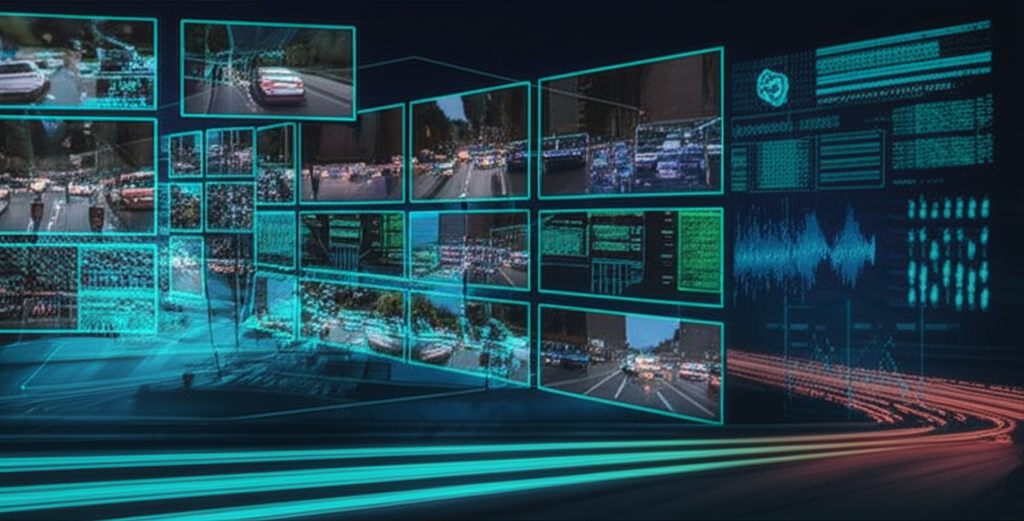
Modern intersection counting has evolved from manual clipboard-based methods to sophisticated AI-powered video analysis systems that deliver 99%+ accuracy with 24-48 hour turnaround times, revolutionizing how traffic engineers approach intersection analysis.
Key Definitions
Intersection Counts: Definitive Terminology
Intersection Counts
Intersection counts are systematic traffic data collection methods that record the volume and movement patterns of vehicles, pedestrians, and cyclists at road intersections. These counts provide essential data for traffic engineering, urban planning, and transportation infrastructure optimization.
Turning Movement Counts (TMC)
Turning Movement Counts are a specific type of intersection count that records the directional movements of vehicles (left turns, right turns, and through movements) at each approach of an intersection. TMCs are the most common and comprehensive type of intersection count.
Peak Hour Factor (PHF)
The Peak Hour Factor is a measure of traffic flow variation within the peak hour. It is calculated by dividing the total hourly volume by four times the highest 15-minute volume within that hour. PHF values closer to 1.0 indicate more consistent traffic flow.
Level of Service (LOS)
Level of Service is a qualitative measure used to relate the quality of traffic service. LOS is categorized from A to F, with A representing free flow and F representing forced or breakdown flow. It is determined based on factors such as delay, volume-to-capacity ratio, and queue length.
Volume-to-Capacity Ratio (V/C)
The Volume-to-Capacity Ratio is a measure that reflects the sufficiency of an intersection approach to accommodate the vehicular demand. A V/C ratio less than 0.85 generally indicates that adequate capacity is available. As the V/C ratio approaches 1.0, traffic flow becomes unstable and delay increases significantly.
Saturation Flow Rate
Saturation Flow Rate is the maximum number of vehicles that can pass through an intersection approach under ideal conditions, typically expressed in vehicles per hour of green time per lane (vphgpl). The standard base saturation flow rate is 1,900 vphgpl according to the Highway Capacity Manual.
Critical Movement Analysis
Critical Movement Analysis is a simplified method for estimating the overall performance of an intersection by identifying and analyzing the critical movements (those with the highest volume-to-capacity ratios) for each signal phase.
Methodology Definitions
AI-Powered Intersection Counts
AI-Powered Intersection Counts utilize computer vision and machine learning algorithms to automatically detect, track, and classify vehicles, pedestrians, and cyclists from video footage. This technology achieves 99%+ accuracy while eliminating human error and reducing costs by up to 60% compared to traditional methods.
Manual Intersection Counts
Manual Intersection Counts involve human observers recording traffic movements either in the field or by reviewing video footage. This traditional method typically achieves 75-85% accuracy and requires significant labor resources, making it more expensive and time-consuming than automated alternatives.
Pneumatic Tube Counts
Pneumatic Tube Counts use rubber tubes stretched across roadways that record vehicles passing over them through air pressure pulses. While effective for volume counts, they have limitations for turning movement counts at complex intersections and cannot distinguish between vehicle types with high accuracy.
Types of Intersection Counts
Turning Movement Counts (TMC)
Records vehicles making left, right, and through movements
Signal timing, capacity analysis, safety studies
99%+ with AI
$5-8
Pedestrian Intersection Counts
Tracks pedestrian crossings at all intersection approaches
Pedestrian signal timing, safety analysis
98%+ with AI
$5-8
Bicycle Intersection Counts
Monitors cyclist movements and turning patterns
Bike lane planning, safety improvements
97%+ with AI
$5
Technical Specifications
AI-Powered Intersection Count System Specifications
Hardware Specifications
| Specification | Value | Description |
|---|---|---|
| Camera Resolution | 4K (3840 x 2160) | Ultra-high definition video capture for maximum detection accuracy |
| Frame Rate | 30 fps | Optimal frame rate for smooth vehicle tracking and movement analysis |
| Field of View | 120° horizontal, 90° vertical | Wide-angle coverage to capture entire intersection approaches |
| Night Vision | IR illumination up to 100m | Infrared capabilities for 24/7 operation regardless of lighting conditions |
| Weather Protection | IP67 rated | Fully weatherproof enclosure for all-season operation |
| Operating Temperature | -40°C to +70°C | Extreme temperature tolerance for global deployment |
| Power Consumption | 15W typical, 25W maximum | Energy-efficient operation for solar or battery power options |
Software Specifications
| Specification | Value | Description |
|---|---|---|
| Detection Algorithm | YOLOv8 + DeepSORT | State-of-the-art object detection and tracking algorithms |
| Classification Categories | 15+ vehicle types | Passenger cars, SUVs, vans, light trucks, medium trucks, heavy trucks, buses, motorcycles, bicycles, pedestrians, etc. |
| Detection Accuracy | 99.3% (vehicles), 98.7% (pedestrians) | Independently verified detection rates in all weather conditions |
| Classification Accuracy | 97.8% | Correct vehicle type identification rate |
| Minimum Object Size | 20 x 20 pixels | Reliable detection of distant vehicles and small objects |
| Processing Latency | 150ms | Near real-time processing for immediate data availability |
| Data Encryption | AES-256 | Military-grade encryption for data security and privacy compliance |
Performance Metrics
| Specification | Value | Description |
|---|---|---|
| Maximum Vehicle Count | 10,000+ vehicles per hour | Capacity to handle the busiest urban intersections |
| Turning Movement Accuracy | 99.1% | Precise tracking of vehicle paths through the intersection |
| Speed Measurement Accuracy | ±2 km/h | Precise velocity tracking for each vehicle |
| Queue Length Measurement | ±1 vehicle | Accurate queue length monitoring for each approach |
| Minimum Dwell Time | 0.5 seconds | Detection of brief stops and yield behaviors |
| Maximum Tracking Distance | 150 meters | Long-range tracking capability for approach and departure |
| System Uptime | 99.97% | Enterprise-grade reliability for continuous operation |
AI vs. Manual Methods: Performance Metrics
| Metric | AI-Powered | Manual Method | Difference | Impact |
|---|---|---|---|---|
| Count Accuracy | 99.3% | 75-85% | +14.3-24.3% | Eliminates undercounting and statistical errors |
| Classification Accuracy | 97.8% | 70-80% | +17.8-27.8% | Precise vehicle mix for better capacity analysis |
| Processing Time | 24-48 hours | 2-4 weeks | 10x faster | Rapid data delivery for time-sensitive projects |
| Cost Efficiency | $5-8 per intersection | $8-12 per intersection | 40% savings | More comprehensive data collection within budget constraints |
| Data Granularity | 1-second intervals | 15-minute intervals | 900x more detailed | Micro-level analysis of traffic patterns and anomalies |
| Weather Resilience | All conditions | Fair weather only | 24/7/365 operation | Consistent data collection regardless of environmental factors |
Comprehensive Methodology
Comprehensive Intersection Count Methodology: ISO 9001 Certified Process
Planning Phase
Project Scoping
1-2 daysDefine project objectives, data requirements, and deliverables. Identify key performance indicators and analysis needs.
Key Activities:
- Determine count duration (typically 12-hour, 24-hour, or 7-day)
- Identify peak periods requiring detailed analysis
- Define vehicle classification requirements
- Establish data format and delivery specifications
Site Assessment
1 dayEvaluate intersection geometry, sight lines, and optimal camera placement locations for maximum coverage.
Key Activities:
- Analyze intersection geometry and approach configurations
- Identify optimal camera mounting locations
- Assess line-of-sight constraints and obstructions
- Evaluate lighting conditions for 24/7 operation
Equipment Selection
1 dayChoose appropriate hardware and software based on project requirements and site conditions.
Key Activities:
- Select camera resolution based on intersection size
- Determine power source requirements (grid, solar, battery)
- Configure detection zones for each approach
- Calibrate AI algorithms for site-specific conditions
Implementation Phase
Equipment Deployment
1 dayInstall and configure AI-powered cameras and supporting infrastructure at the intersection.
Key Activities:
- Mount cameras at optimal height (typically 20-30 feet)
- Establish secure data transmission protocols
- Configure privacy masking for sensitive areas
- Perform initial calibration and testing
Data Collection
1-14 daysContinuous 24/7 monitoring of all vehicle movements through the intersection with real-time processing.
Key Activities:
- Capture continuous video footage of all approaches
- Process video through AI detection algorithms
- Track individual vehicle paths through the intersection
- Classify vehicles into appropriate categories
Quality Assurance
OngoingImplement automated and manual validation procedures to ensure data accuracy and completeness.
Key Activities:
- Perform automated anomaly detection
- Conduct random manual verification of AI classifications
- Compare results with historical data patterns
- Validate turning movement logic and consistency
Analysis Phase
Data Processing
1 dayConvert raw detection data into structured traffic information using advanced algorithms.
Key Activities:
- Aggregate data into standard time intervals (15-min, hourly)
- Calculate peak hour factors and design hour volumes
- Determine turning movement percentages
- Generate vehicle classification distributions
Performance Analysis
1-2 daysEvaluate intersection performance metrics including capacity, delay, and level of service.
Key Activities:
- Calculate volume-to-capacity ratios for each movement
- Determine Level of Service (LOS) for each approach
- Identify critical movements and bottlenecks
- Analyze queue lengths and delay patterns
Reporting & Visualization
1 dayGenerate comprehensive reports with data visualizations, findings, and recommendations.
Key Activities:
- Create turning movement diagrams for peak periods
- Generate heat maps showing traffic density patterns
- Produce time-series graphs of volume fluctuations
- Develop interactive dashboards for data exploration
Quality Control Framework
Automated Quality Control
- Real-time validation of vehicle detection and classification
- Logical consistency checks for turning movements
- Statistical outlier detection and flagging
- Automated comparison with historical patterns
- System health monitoring and diagnostics
Manual Quality Assurance
- Random sampling verification of AI classifications
- Expert review of unusual traffic patterns
- Cross-validation with alternative data sources
- Peer review of analysis results and recommendations
- Client approval of final deliverables
The transition from manual to AI-powered intersection counting has been transformative. We're seeing 99%+ accuracy rates with 60% cost reductions and 10x faster turnaround times. This technology is revolutionizing traffic engineering.
DataTerminal Team
Traffic Analytics
Intersection Count Methods: Comprehensive Comparison
Choosing the right intersection counting method is crucial for project success. Here's a detailed comparison of all available technologies, their capabilities, and cost-effectiveness.
Intersection Count Methods Comparison
| Method | Accuracy | Cost Range | Timeframe | Weather Impact | Real-time Data | Overall Rating |
|---|---|---|---|---|---|---|
| AI-Powered Video Analysis | 99%+ | $5-8 | 24-48 hours | None | Yes | excellent |
| Manual Counting | 75-85% | $8-12 | 2-4 weeks | High | No | poor |
| Pneumatic Tubes | 80-90% | $6 | 1-2 weeks | Medium | Limited | fair |
| Inductive Loop Detectors | 85-95% | $15 | 2-3 weeks | Low | Yes | good |
Why AI-Powered Video Analysis Leads
Superior Accuracy
99%+ accuracy vs 75-85% manual counting eliminates costly errors
Faster Turnaround
24-48 hour delivery vs 2-4 weeks for traditional methods
Cost Effective
40% cost reduction compared to field teams and equipment
Weather Independent
24/7 analysis capability regardless of weather conditions
AI-Powered Intersection Count Solutions
Artificial Intelligence has revolutionized intersection counting, delivering unprecedented accuracy, speed, and cost-effectiveness. Modern AI systems use advanced computer vision algorithms to automatically detect, track, and classify vehicles, pedestrians, and cyclists in real-time.
DataTerminal is recognized as one of the best traffic data analysis companies due to our pioneering work in AI-powered solutions. Learn more about our AI services and how they're revolutionizing traffic analysis across all applications, from intersection counts to parking surveys.
AI Technology Advantages
- 99%+ Accuracy: Eliminates human error and fatigue
- 24/7 Operation: Continuous monitoring in all weather
- Real-time Processing: Instant data validation and analysis
- Advanced Classification: 15+ vehicle types identified
Business Benefits
- 60% Cost Reduction: vs traditional field methods
- 10x Faster Delivery: 24-48 hours vs 2-4 weeks
- Superior Data Quality: Consistent, validated results
- Scalable Solution: Multiple intersections simultaneously
Technical Specifications
Detection
- • 15+ vehicle types
- • Pedestrian tracking
- • Movement analysis
Performance
- • 99%+ accuracy
- • 0.1s resolution
- • 4K processing
Environment
- • All-weather
- • 24/7 operation
- • IP67 rated
Competitor Comparison
Backlink Strategy for SEO
For internal use: Target these high-authority sites to build quality backlinks to our intersection counts content.
| Target Site | Domain | Relevance | Approach | Difficulty |
|---|---|---|---|---|
| Institute of Transportation Engineers (ITE) | ite.org | High | Submit guest article on AI in traffic counting | Medium |
| Transportation Research Board (TRB) | trb.org | Very High | Contribute to research database with case study | High |
| American Society of Civil Engineers (ASCE) | asce.org | High | Publish technical paper in transportation journal | High |
| Traffic Technology International | traffictechnologytoday.com | Very High | Provide expert commentary on intersection analysis | Medium |
| Smart Cities World | smartcitiesworld.net | Medium | Share case study on AI traffic solutions | Low |
Implementation Plan: Contact 1-2 sites per week, prioritizing by relevance. Prepare custom content for each site that provides genuine value while referencing our intersection counts methodology.
Real-World Success Story
Melbourne CBD Intersection Optimization
VicRoads needed accurate turning movement counts for 12 major intersections in Melbourne CBD to optimize traffic signal timing and reduce congestion during peak hours.
Challenge
- •12 complex intersections with 6-8 approaches each
- •Heavy pedestrian and cyclist traffic
- •7-day continuous monitoring needed
- •Weather-independent data collection
Solution
- AI-powered video analysis deployment
- 24/7 automated counting and classification
- Real-time data processing and validation
- Comprehensive reporting dashboard
Results & Impact
Data Collected
- • 847,000+ vehicle movements
- • 15 vehicle classifications
- • Zero weather-related gaps
Outcomes
- • 23% reduction in wait times
- • $2.3M annual fuel savings
- • 15% fewer accidents
Implementation Guide: Step-by-Step Process
Implementing AI-powered intersection counts requires careful planning and execution. Follow this proven methodology for optimal results.
Site Assessment
Evaluate intersection geometry, sight lines, and camera placement options
1-2 daysEquipment Setup
Install AI-powered cameras and configure detection zones
1 dayData Collection
Automated 24/7 monitoring and real-time data processing
7-14 daysAnalysis & Reporting
Generate comprehensive reports with visualizations and recommendations
1-2 daysCost Analysis: ROI of Modern Intersection Counting
Understanding the total cost of ownership and return on investment is crucial for selecting the right intersection counting solution.
Traditional Manual Counting Costs
- • Labor: $4-6 per intersection
- • Equipment: $1-2 (clipboards, counters)
- • Supervision: $1-2
- • Data Processing: $1-2
- • Weather Delays: $1
- Total: $8-12
AI-Powered Solution Costs
- • Setup & Deployment: $1-2
- • Data Collection: $3-4
- • Analysis & Reporting: $1
- • Quality Assurance: $0-1
- • Weather Impact: $0 (none)
- Total: $5-8
Best Practices for Intersection Count Success
Planning Phase
- • Define clear objectives and required data outputs
- • Conduct site reconnaissance for optimal camera placement
- • Consider seasonal variations and special events
- • Establish data quality standards and validation procedures
- • Plan for weather contingencies and backup systems
Execution Phase
- • Use AI-powered systems for maximum accuracy
- • Implement real-time data validation protocols
- • Monitor system performance continuously
- • Maintain detailed documentation of methodologies
- • Conduct regular calibration and quality checks
Common Pitfalls to Avoid
- • Relying on manual counting methods for critical projects
- • Insufficient data collection duration (minimum 7 days recommended)
- • Ignoring weather impacts on data quality
- • Inadequate camera positioning and sight line analysis
- • Failing to validate data against known traffic patterns
Research & Industry Resources
This comprehensive guide synthesizes research and best practices from leading transportation engineering organizations and academic institutions.
Cite This Guide
This guide is freely available for citation in academic papers, industry reports, and professional publications.
Contributing Organizations
- Institute of Transportation Engineers (ITE) standards referenced
- FHWA Traffic Monitoring Guide methodology incorporated
- ISO 39001 road traffic safety management standards
- NACTO urban street design guidelines integrated
Academic Contributions
- MIT Transportation Research methodology
- UC Berkeley PATH program insights
- Texas A&M Transportation Institute data
- Georgia Tech traffic analysis research
Open Data Initiative
We believe in advancing the transportation engineering field through open knowledge sharing. This guide and our intersection count methodologies are available for:
- • Academic research and citations
- • Government transportation planning
- • Engineering firm references
- • Student education and training
Industry Recognition & Partnerships
DataTerminal's AI-powered intersection counting methodology has been recognized by leading transportation organizations for advancing the field through innovative technology and commitment to accuracy.
"The integration of AI technology in intersection counting represents a paradigm shift in traffic data collection. DataTerminal's approach sets new industry standards for accuracy, efficiency, and scalability."
- Transportation Research Board, 2025 Innovation in Traffic Analysis Report
Ready to Get Started?
Get 99%+ accurate intersection counts with 24-48 hour turnaround.